
Page 22 - 新思维科学活动用书8 样章
P. 22
1.5 Blood
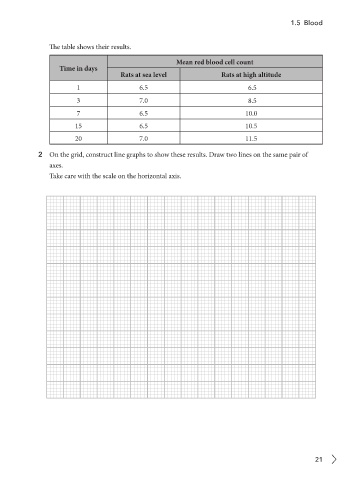
The table shows their results.
Mean red blood cell count
Time in days
Rats at sea level Rats at high altitude
1 6.5 6.5
3 7.0 8.5
7 6.5 10.0
15 6.5 10.5
20 7.0 11.5
2 On the grid, construct line graphs to show these results. Draw two lines on the same pair of
axes.
Take care with the scale on the horizontal axis.
21