
Page 23 - 新思维科学活动用书9 样章
P. 23
1 Photosynthesis and the carbon cycle
1.4 Climate change
Exercise 1.4 Interpreting graphs about climate change
In this exercise, you will look at graphs displaying data collected by NASA (the USA’s National
Aeronautics and Space Administration) and NOAA (the USA’s National Oceanic and Atmospheric
Administration). You will need to study the graphs carefully to answer the questions, and also use
your own knowledge about photosynthesis, the carbon cycle and climate change.
Focus
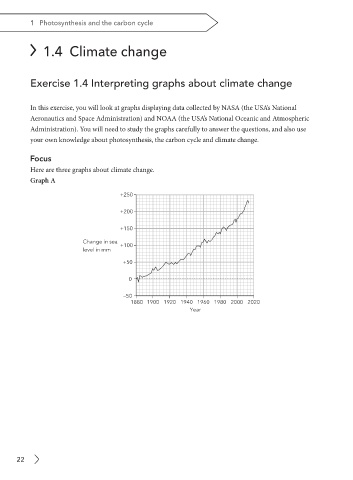
Here are three graphs about climate change.
Graph A
+250
+200
+150
Change in sea +100
level in mm
+50
0
−50
1880 1900 1920 1940 1960 1980 2000 2020
Year
22