
Page 24 - 新思维科学活动用书9 样章
P. 24
1.4 Climate change
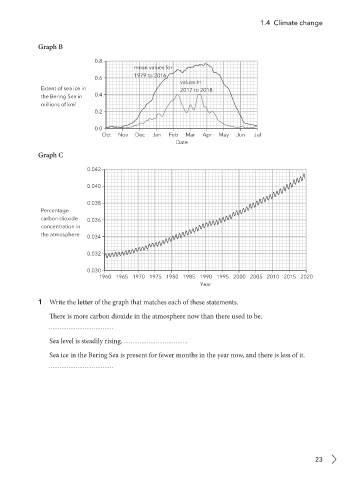
Graph B
0.8
mean values for
0.6 1979 to 2016
values in
Extent of sea ice in 2017 to 2018
the Bering Sea in 0.4
millions of km 2
0.2
0.0
Oct Nov Dec Jan Feb Mar Apr May Jun Jul
Date
Graph C
0.042
0.040
0.038
Percentage
carbon dioxide 0.036
concentration in
the atmosphere 0.034
0.032
0.030
1960 1965 1970 1975 1980 1985 1990 1995 2000 2005 2010 2015 2020
Year
1 Write the letter of the graph that matches each of these statements.
There is more carbon dioxide in the atmosphere now than there used to be.
Sea level is steadily rising.
Sea ice in the Bering Sea is present for fewer months in the year now, and there is less of it.
23