Page 25 - 新思维数学学生用书3 样章
P. 25

2   Statistics: tally charts and frequency tables


               2.1  Tally charts and frequency tables


             We are going to …


             •  conduct investigations to answer non-statistical and

                 statistical questions

             •  record, organise and represent data using a tally chart

                 and a frequency table

             •  describe data and discuss conclusions.


           You are planning a party

           for your class. You want
           to know what drinks to

           order. What question                    What is your

           could you ask?                        favourite drink?

           You could record your

           data in a tally chart.
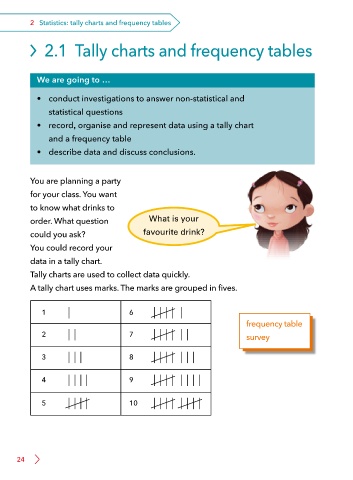
           Tally charts are used to collect data quickly.

           A tally chart uses marks. The marks are grouped in fives.


               1                             6

                                                                                    frequency table
               2                             7                                      survey


               3                             8


               4                             9


               5                             10


       24
   20   21   22   23   24   25   26   27   28   29   30