Page 26 - 新思维数学学生用书3 样章
P. 26

2.1  Tally charts and frequency tables


              Once your tally chart is complete, you could make a frequency

              table. A frequency table uses a number to show how many

              times something occurs. This makes it easy to read because

              you do not need to count the tally marks each time.


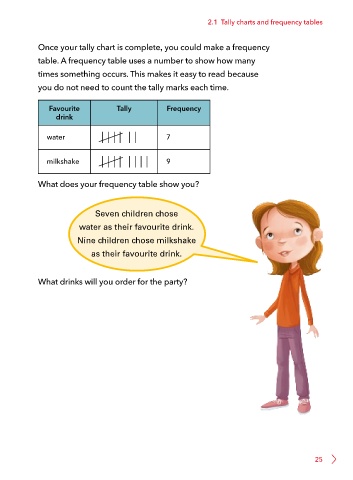
                  Favourite             Tally            Frequency
                    drink


                 water                                   7


                 milkshake                               9


              What does your frequency table show you?


                                 Seven children chose
                            water as their favourite drink.

                           Nine children chose milkshake

                                as their favourite drink.


              What drinks will you order for the party?


                                                                                                           25
   21   22   23   24   25   26   27   28   29   30   31