
Page 33 - 新思维数学学生用书3 样章
P. 33
2 Statistics: tally charts and frequency tables
Check your progress
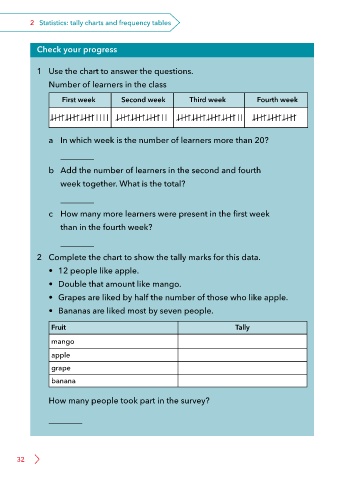
1 Use the chart to answer the questions.
Number of learners in the class
First week Second week Third week Fourth week
a In which week is the number of learners more than 20?
b Add the number of learners in the second and fourth
week together. What is the total?
c How many more learners were present in the first week
than in the fourth week?
2 Complete the chart to show the tally marks for this data.
• 12 people like apple.
• Double that amount like mango.
• Grapes are liked by half the number of those who like apple.
• Bananas are liked most by seven people.
Fruit Tally
mango
apple
grape
banana
How many people took part in the survey?
32