
Page 34 - 新思维数学学生用书3 样章
P. 34
2.1 Tally charts and frequency tables
Continued
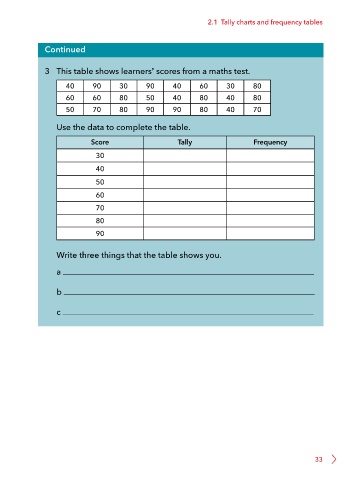
3 This table shows learners’ scores from a maths test.
40 90 30 90 40 60 30 80
60 60 80 50 40 80 40 80
50 70 80 90 90 80 40 70
Use the data to complete the table.
Score Tally Frequency
30
40
50
60
70
80
90
Write three things that the table shows you.
a
b
c
33